In virtually every emergency, 4W (or 3W, now even 5W: Who, What, Where, When, for Whom) matrixes are considered the cornerstone of humanitarian reporting. Intense efforts are put into establishing the reporting system as soon as possible. Derivative products, infographs and maps in primary colors, are created and disseminated widely, as a demonstration that the humanitarian coordination machine is functioning, and that the situation is under control.
Research on this product continue, and an additional “W” is added every couple of years. Online reporting portals are established, linking to programmatic management systems. The ambition is not to have a “masterplan: where all information about needs, response, plans, is collected, analyzed, displayed.
Strange destiny for what was born as humble product.
The original 3W matrixes were a simple product whose ambition was simply to understand… well… who is doing what, and where, in a given moment in time, and support the basic function of coordination, to avoid duplications, overlaps and gaps. Despite the ambition, in every emergency, the agencies in the field lament that products derivate from 4W (3.5) are, at best, “interesting”, when not outright useless. But management in distant headquarters, unfortunately, is more and more tempted to rely on 4w reports as evidence for decision making. This is,at best, misleading, or outright dangerous.
Fact is – I will argue in this post – regardless the number of Ws and the sophistication of the procedures, the only reliability of this product still remains the original understanding of who, what, where, in a moment in time. The ambition of using this tool as planning and monitoring is poorly placed. This tool, at best, is monitoring cumulative, overestimated outputs, and not outcomes. The gap analysis derivate from the 4W is misleading: and the ever increasing complexity of the reporting procedures simply rises the bar for local NGOs, increase transactional cost, and overall diminish the reliability of the data.
Why? Well, this is somehow not intuitive, so I will try to make a practical example on how things really work.
4W IN QUASI-REAL-LAND
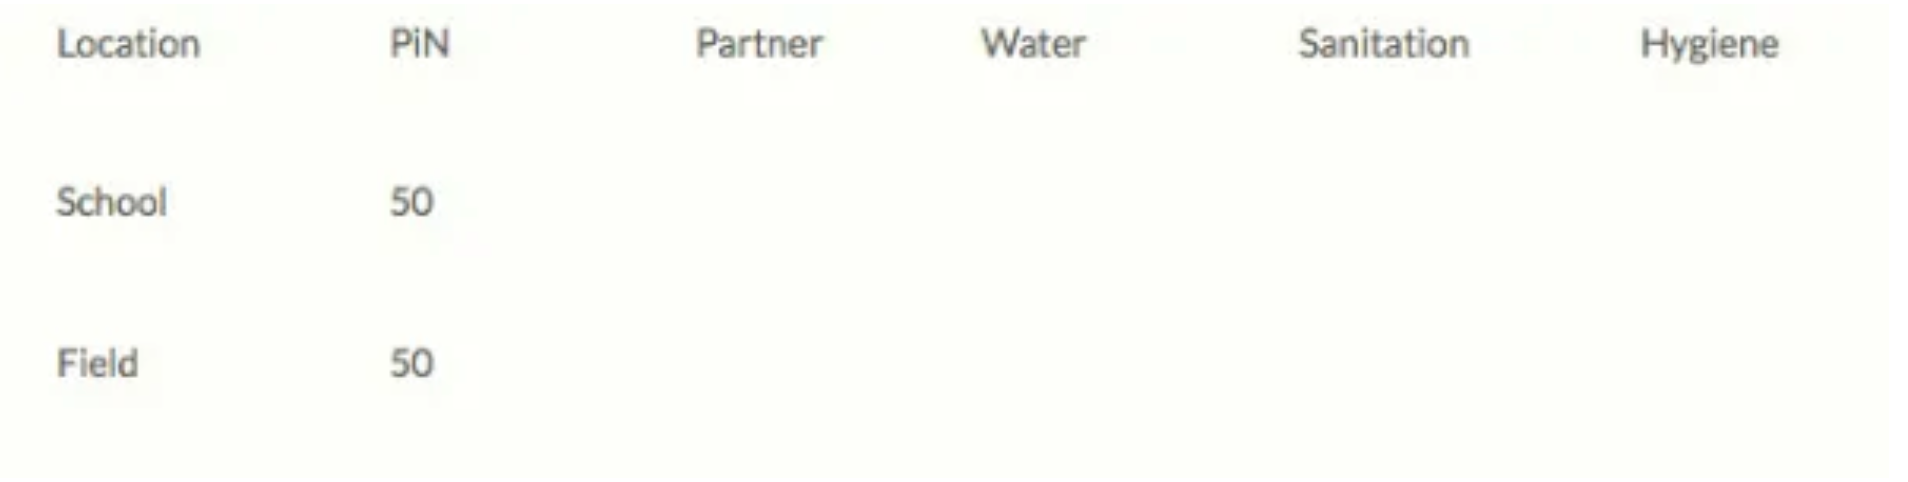
Once upon the time, in a rural and underdeveloped part of this world, a flood displaced 100 people for two months. 50 people find refuge in a school, and other 50 camped, is some way, in the middle of an empty field.
A multi sector rapid assessment reported that 100 people needed assistance in the two locations. The WASH cluster strategy stated that the package shall include access to water, sanitation, and hygiene. An appeal was issued, asking funds for the full package, for 100 people.
A 3 W matrix was set up. (we will keep it simple with a 3W in this example, but 4 and 5w matrixes have the same issues) Two locations. In one column, the PiN (People in Need). 50 in the first location, 50 in the second. The cluster decided to divide the reporting into three activities.
A 3 W matrix was set up. (we will keep it simple with a 3W in this example, but 4 and 5w matrixes have the same issues) Two locations. In one column, the PiN (People in Need). 50 in the first location, 50 in the second. The cluster decided to divide the reporting into three activities.
Only 50% of the funds requested become available, and were given to two NGOs. Via cluster, the two NGOs decide to concentrate in different locations.
The two NGOs make a in depth assessment: NGO1 finds out that the school has sufficient toilets, but no water supply. NGO2 finds that the empty field is close to a spring. NGO1 decides to provide water via trucking for two months, and make two distributions of hygiene kits, one each month. There are no funds left for sanitation, but the sanitation is present. NGO2 will construct temporary toilets, distribute hygiene kits monthly. No money for the improvement of the spring is available, but a water kit, including water purification tablets and jerrycans will be added to the first distribution.
The first month, the 3W will look like this:
The first month, the 3W will look like this:
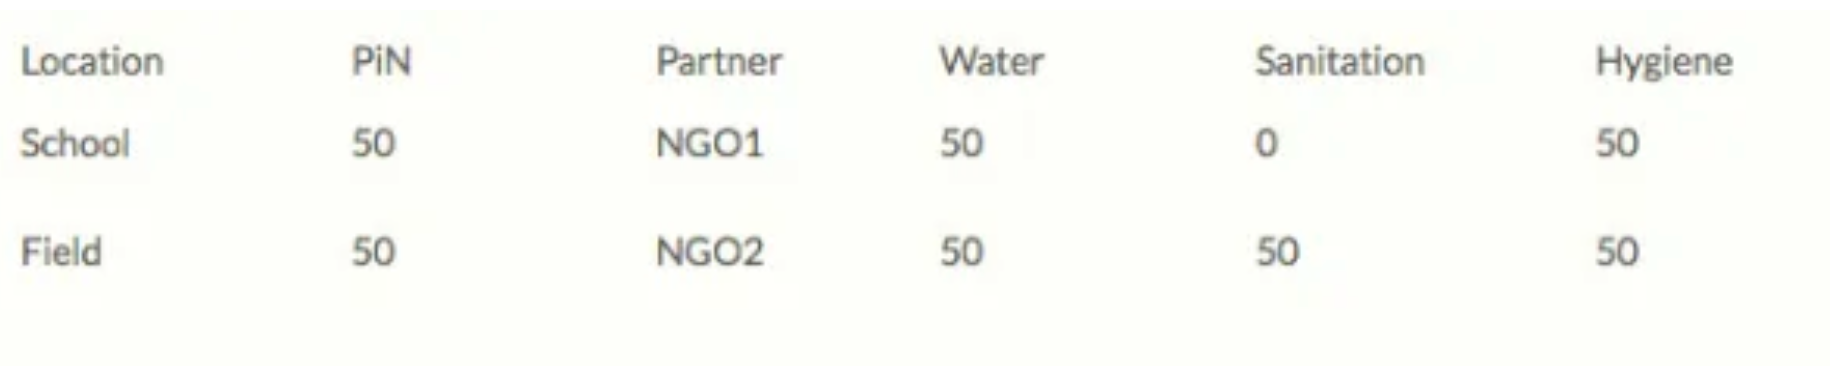
The initial count of beneficiaries is 250. Preoccupied, the IM conceives a smart deconfliction system built-in in the reporting of the 3W that will not report twice the same activities in the same location, for the same people. After deconfliction, the count now is 100.
Due to the high number of occupants, the school toilets soon fill up, and people start defecating in the open. NGO 1 has no money for the desludging, but construct two emergency VIP (Ventilated, Improved, Pit latrines) toilets in the playground of the school. The local population is used to flush toilets, and the VIP toilets quickly become dirty and unusable. 25 people moved back home, but 30 new people arrived in the school NGO1 provided hygiene kits for the new arrivals.
In the camp, in the meantime, people do not use the chlorine tablets because are giving bad taste to water. The project manager away for R&R, and the replacement forgets to report to the cluster.
The next month, this is the new report:
The next month, this is the new report:
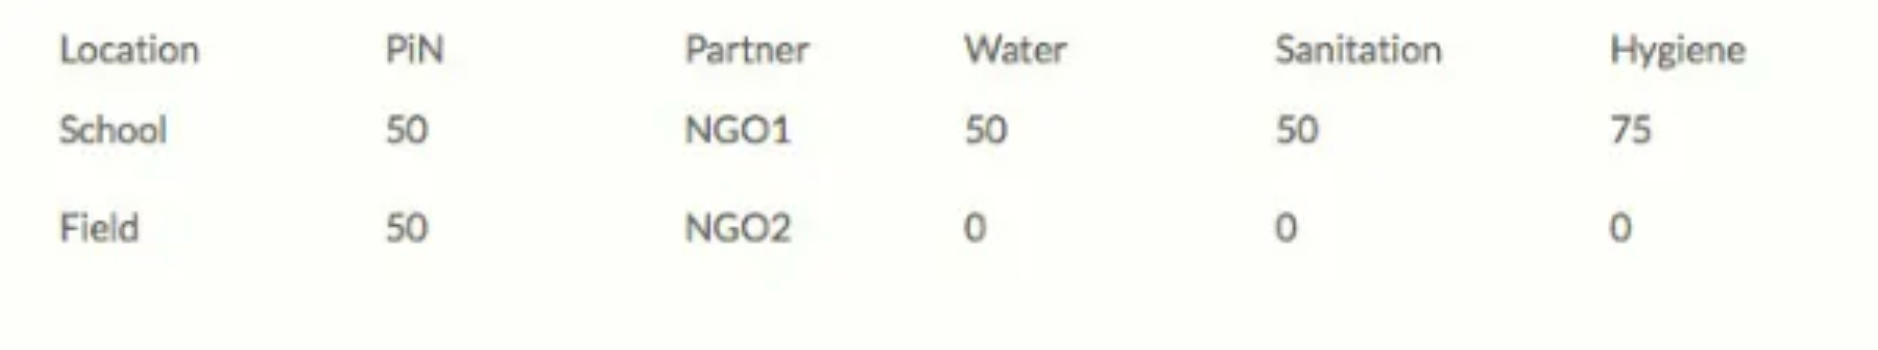
In the school, 30 people are new, but 25 went home, so the “real” PiN is now 55. For what the 3W PiN is concerned, change will happen on an annual base, for the new appeal.
NGO1 reported new activity in sanitation (for 50 people) and distributed hygiene kits to both exiting and entering population. NGO2 did not report this month. The deconfliction system works well in avoid double-counting same activity for the same people, but people moved, and sanitation in school is a new activity. Total reported beneficiaries is now 180 The IM of the WASH cluster will report that only 50% of the partners contributed to the 3W therefore the report is incomplete.
A periodic report is issued for the Sitrep (situation Report), with information from the 3W:
Total Funds received: 50%. Achievement: 180%. Footnote lamenting incomplete reporting.
This is absolutely typical. How embarrassing.
The Cluster Coordinator is concerned, and travels to the programme locations. The field assessment, based on observations of open defecation, and unused chlorine tablets, concluded that 50 people in the school live in an environment with open defecation, and there is no handwashing going on. In the field, people drink unsafe water from the spring, and there are no signs of handwashing either. In conclusion: achievement on outcomes (effectiveness): around 33%. water (1/3 of the package in the school) and sanitation (1/3 of the package) in the field. Number of the beneficiaries (for 1/3 of the package) =130 (100+30). Number of people in need (for the 2/3 of the package) =105 (100-25+30).
So the summary report would be:
Funds received: 50%. Achievement: 33%. Beneficiaries: 130 (100% of PiN2). Gap (Residual people in need): 105 (100% of PiN3)
Funds received: 50%. Achievement: 33%. Beneficiaries: 130 (100% of PiN2). Gap (Residual people in need): 105 (100% of PiN3)
Confused? You should be. In the real world, things are even more complex (more agencies will work in the same location and the same beneficiaries might relocate more than once, especially in conflict) but the dynamics often are quite similar.
Experience is that not only the numbers provided by the 3/4/5W matrixes are often unreliable: but, more importantly, they are of no use to help understanding the challenges and bottlenecks in the response.
Experience is that not only the numbers provided by the 3/4/5W matrixes are often unreliable: but, more importantly, they are of no use to help understanding the challenges and bottlenecks in the response.
Methods for deconfliction are always very complex and laborious and their effectiveness vary place by place, and month by month. But even in presence of a theoretically perfect deconfliction system, the concept of counting “reached” against “PiN”(which PiN?) is incorrect, and it is not what the WASH sector needs.
4W (3,5) MATRIXES ARE USEFUL TO TRACK THE REACH OF PARTNERS, NOT NEEDS OR COVERAGE
WORKING IN WONDERLAND
Let us assume that in an emergency in Wonderland PiNs were calculated against every activity of every cluster, and kept up to date periodically. Always in this wonderland, all partners are reporting to 6W (who, what, where, when, for whom, why) matrixes providing 100%, fully accurate information, and no double counting of beneficiaries can ever happen. There is also full agreement between the clusters and the host government about the population movements.
Still, in Wonderland, the 6W matrix, like any other high frequency reporting system, will capture outputs “dressed” as outcomes (i.e.the reporting agency will count the toilets constructed, and multiply the number by 20 ( 30, 50 presumed users) and not if they are effectively functional, or even used. Moreover, as the 4W (3,5) are cumulative, a toilet out of order (or abandoned because of movement of population) will continue to add up indefinitely.
In other words, it seems obvious that once we know the PiN (what “needs to be done”) and we know the n. reached (” what has been done”) the gap will be the difference of the two. Well, not really, because the output of the activity ” hygiene promotion message” does not necessarily ( and often does not) delivers the ” people washing hands” desired outcome. QUALITY, EFFECTIVENESS, are not captured by the 4W, but often here is where the gaps are. At best, we measure effort, not results. Managers should strive for results, so can not rely on 4W as source of information.
DIFFERENT TOOLS FOR DIFFERENT PURPOSES
The “original sin” of 4W (3,5) matrixes is that they will never tell us anything about the real effectiveness of the response, ad noting about gaps in the needs of people. In other words, in the best possible case, 4W (3,5) matrices can aim at capturing efficiency (activities vs. plan) and not effectiveness ( activities vs. results, or outcomes).
GAP ANALYSIS SHOULD MADE AT OUTCOME LEVEL” WHILE THE 3(4,5) W MATRIXES CAPTURE OUTPUT LEVEL DATA “DRESSED” AS OUTCOMES.
Outcomes are about behaviors, therefore will need a tool (i.e. KAP -Knowledge, Attitude, practices- or Action reviews, etc. ) different from agency reporting, and on a lower frequency ( six-12 months).
The WASH cluster routinely lament low funding levels, reports over 100% results, and advocate for additional WASH activities, as gaps, in our sector, are often quite evident.
The job of cluster and agencies alike is to provide an “effective” response. The 4W (3,5) will provide a monthly update on activities going on. The expectation of 4W (3,5) being used as gap analysis tool is misleading, and put a burden on the coordinators and managers, that need to devolve scarce resources to “feed the beast” and, at the same time, trying to find a way to actually monitor the response.
Originally posted on February 21, 2018